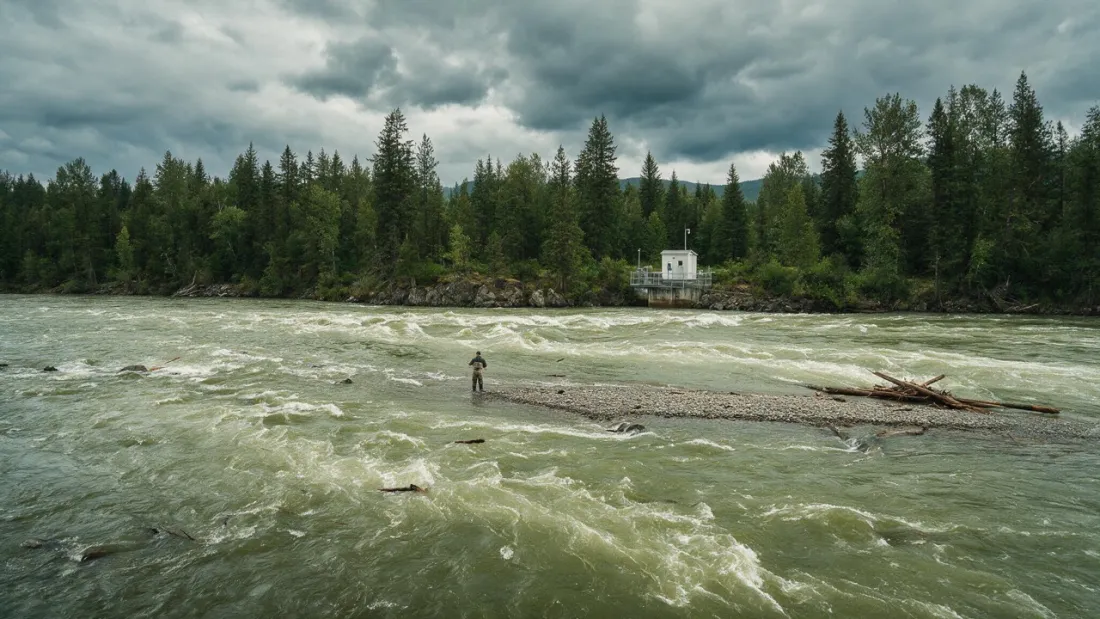
The numbers a gauge gives you
The USGS defines stage, or gage height, as the height of the water surface in feet above a zero point that is arbitrary but often close to the streambed; its gauges record it, usually every 15 minutes, to the nearest 0.01 foot or 0.2% of stage, whichever is greater. Discharge, in cubic feet per second (cfs), is the volume of water passing the gauge. It is not measured continuously: USGS crews measure flow in the field every 6 to 8 weeks across a range of stages, build a rating curve for that site, and convert each stage reading into discharge. On reservoirs, the reading is the lake's elevation above a datum, which operators compare with set levels such as normal conservation pool and the top of the flood pool. Where one of our water pages has a gauge, it shows the latest value and a 30-day chart.
Rivers: compare with the river's own history
A flow means little without the river's own normal for that time of year. The USGS state maps in Water Data for the Nation compare each gauge's discharge with historical daily values for the date, expressed as percentiles, a job its older WaterWatch service used to do. Where our page has a matching river gauge, a panel places today's flow among the percentiles for the date; anything between the 25th and 75th percentile sits in the middle half of past years. The report line also says whether the flow is steady, rising or dropping against a week earlier. Many anglers wait for a river to fall back after a rise; in one Arkansas Game and Fish Commission report from the White River, a Calico Rock outfitter said the fishing picked up as the water dropped through the day.
An idealized hydrograph after rain: the rise, the fall as the water clears, and the return to stable flow.
Reservoirs: elevation against pool
Arkansas Game and Fish Commission fishing reports give each lake's elevation alongside its normal conservation pool and the top of its flood pool, which shows at a glance whether a lake is low, full or holding floodwater. Our lake pages print the level and how far it sits above or below conservation pool, plus the change over the past week. A lake well above pool is often releasing heavily downstream, which matters if you fish the tailwater below it.
What a gauge can get wrong
The USGS notes that the link between stage and flow shifts as channels change through erosion, deposition, seasonal vegetation growth, debris or ice, and that ratings are adjusted as new measurements come in. Recent data are provisional: improbable values are screened automatically, but instrument problems or changes at the site can lead to substantial revisions later, and the USGS asks users to consider this before decisions that affect personal safety. A gauge also describes the water where it sits, not a tributary miles away. Some USGS stations record water temperature too; our pages do not show it yet, so open the station page from the sources block if you need it.
Building your own gauge habit
Note the gauge reading every time you fish your home water, alongside how the day went. After a season you will have your own record of which flows or levels suited you and which did not, and the USGS percentile for the date will tell you whether today is ordinary or unusual.
A five-minute morning check
Open your water's page and read, in order: the level or flow and its weekly change; the pressure verdict; the wind against the banks you planned to fish; and the day's windows against your free hours. Then glance at the sources block to see when the gauge last reported.
Common questions
What is a good cfs for fishing?
There is no single number, because flows differ by river. Compare today's discharge with the USGS percentiles for the date: between the 25th and 75th percentile, the river is within the middle half of past years for that day.
What is the difference between gage height and discharge?
Gage height is how high the water surface stands above a fixed zero point at the gauge. Discharge is how much water flows past, in cubic feet per second, calculated from gage height using a rating curve the USGS builds from field measurements.
Why did yesterday's gauge reading change?
Recent USGS data are provisional and can be revised after field checks, for example when ice, weeds or debris affected the sensor or the channel.
Pages checked
- usgs.gov/water-science-school/science/how-streamflow-measured
- waterdata.usgs.gov/provisional-data-statement
- waterdata.usgs.gov/blog/wdfn-stats-delivery
- agfc.com/news/arkansas-wildlife-weekly-fishing-report-123
The facts on this page were checked against these pages, from the agencies, scientific bodies and studies that cover the subject on October 6, 2026; anything we could not verify was taken out.